ECharts - Charts & Graphs WordPress Elementor Plugin
What is ECharts?ECharts is an Elementor add-on that helps to create a professional, interactive and beautiful looking charts and graphs for your website.Why
 www.templatemonster.com

What is ECharts?
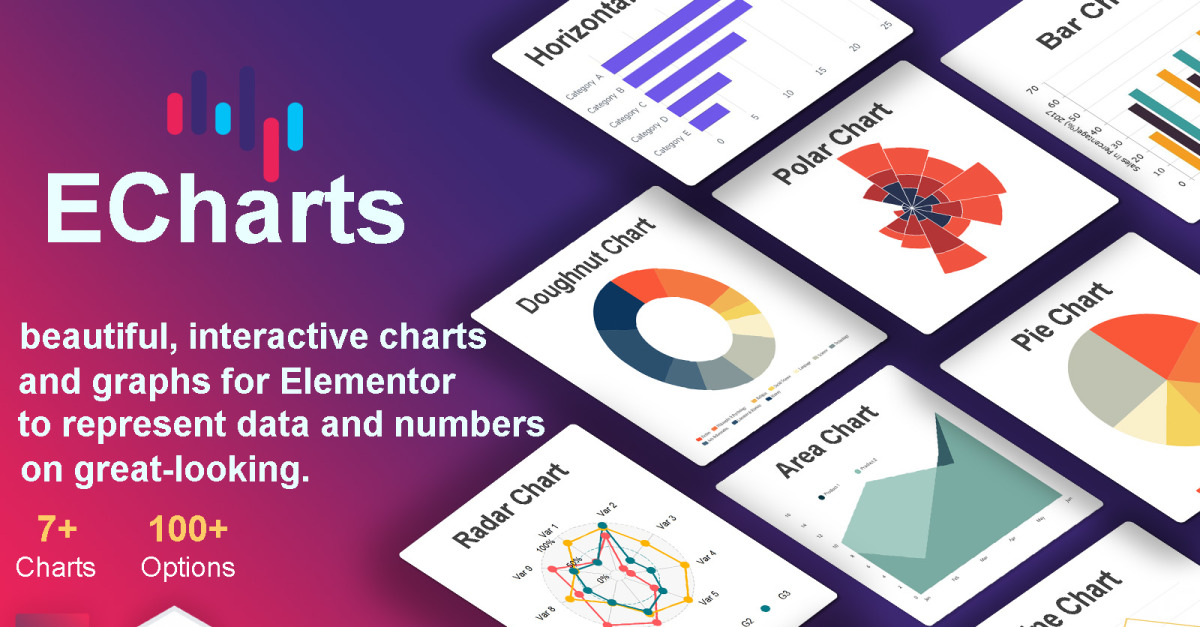
ECharts is an Elementor add-on that helps to create a professional, interactive and beautiful looking charts and graphs for your website.Why Choose Our Plugin
- Different Chart Types.
- Live Preview on Page Builder.
- Fully Responsive.
- Highly Customizable(+100 Options).
- Colorful Options.
- Built on Chart.js Library.
- Cross-Browser Support.
- Usability Easy.
- Detailed documentation.
Plugin Features
- Chart Type Includes: Line, Bar, Doughnut, Pie, Radar, Polar, Area...
- Customizable Tooltips(Show/Hide, Shared, Style).
- Customizable Legends(Show/Hide, Position, Style).
- Categories Configuration(Show/Hide, Percentage, Position, Rotation, Prefix & Postfix, Style...).
- Axes Settings(Grid & Angle Lines, Title, Border, Labels, ...).
- Chart Box(Show/Hide Card, Chart Title, Description, Style...).
- Data Color (Different/Single Random Color or Personalized Color).
- Multiple Datasets(You can set the number of datasets).
- And More...